|
|
|
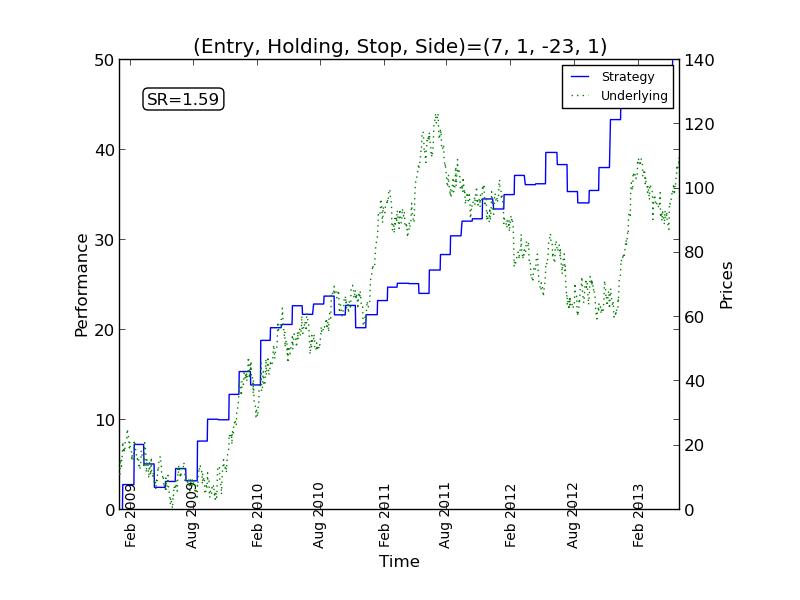
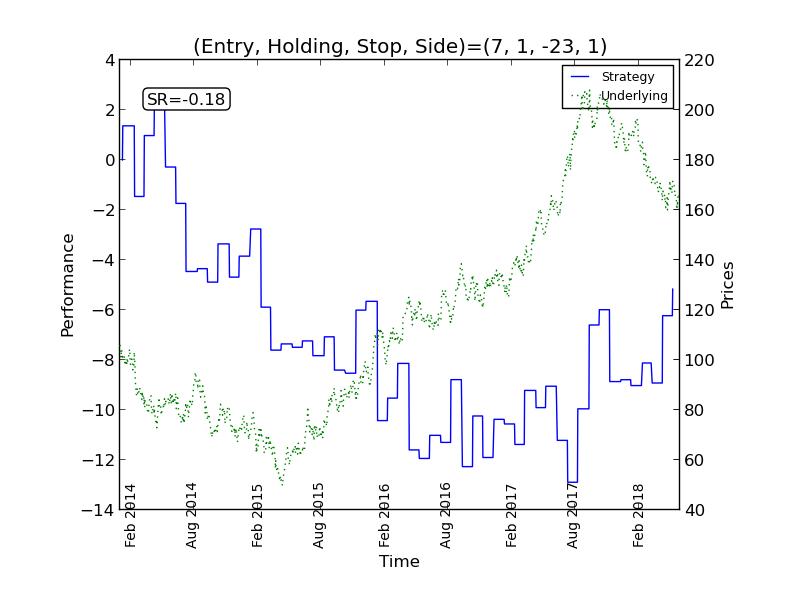
| Graphic on left shows an investment strategy (in blue) making steady profit while the underlying trading instrument (in green) gyrates in price. This website is designed to illustrate that this type of "optimal" investment strategy is all too easy to produce if enough variations are tried, yet it is typically ineffective moving forward, a consequence of backtest overfitting. | Graphic on right shows the same investment strategy performing poorly on a different sample of the same trading instrument, which demonstrates that an overfit investment strategy is quite likely to fail in real world investing. |
|
By checking this box, you acknowledge that this web site is a
demonstration of a mathematical concept known as "backtest
overfitting." The software and material on this site should NOT be
interpreted as a recommendation to buy or sell any security or
securities; as applicable to the specific investment needs of any
particular individual or organization; or as applicable to the
forecast of future market prices or trends.
| ||
Option 1: Repeat the example above | ||
| Please be patient! The program may take up to two minutes to display the results page after clicking Go! button | ||
Option 2: Try with random parameters | ||
| Please be patient! The program may take up to two minutes to display the results page after clicking Go! button | ||
| This "quick-start" option uses random (system generated) values for all of the inputs available in Option 3. | ||
Option 3: Try with your own parametersYou can enter values in one or more of the text boxes below. A more detailed explanation of what each box does is provided in the tutorial document below. | ||
Option 4: Try with stock market dataYou can enter values in one or more of the text boxes below. | ||
Default values: If you do not enter a value or enter a value that is outside the range mentioned above, a default value will be used. The default values are: maximum holding period = 7; stop loss = 10; sample length = 1000; and standard deviation = 1.
About execution time: The values for maximum holding period, stop loss and sample length significantly affect the number of iterations performed by the program; the larger these values are, the longer the program will run.
A more detailed explanation of options is provided in the tutorial.
We gratefully acknowledge the helpful comments and suggestions from colleagues and friends in shaping this web site. In particular, the suggestions from Mr. David Witkin of StatisTrade, Bin Dong of LBNL, and Beytullah Yildiz of Turkey were extensive and very helpful in improving readability of the web pages. Thanks!