|
|
|
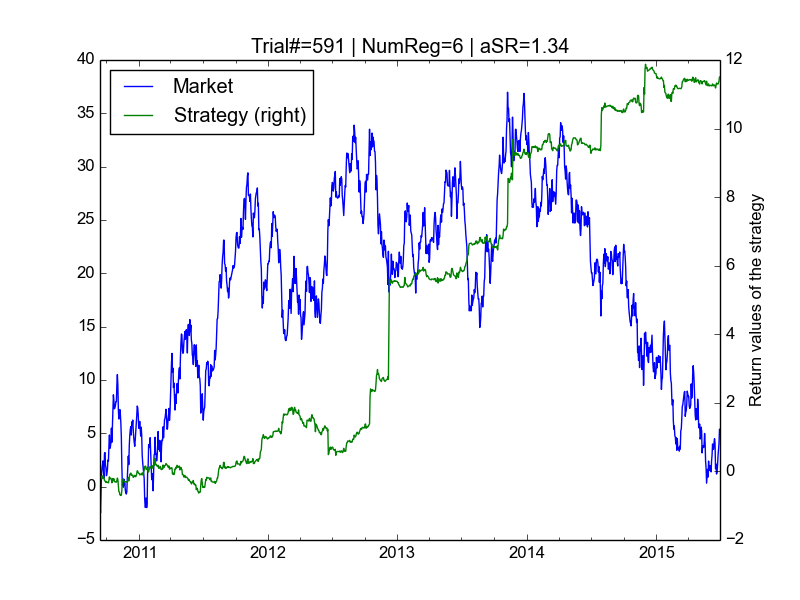
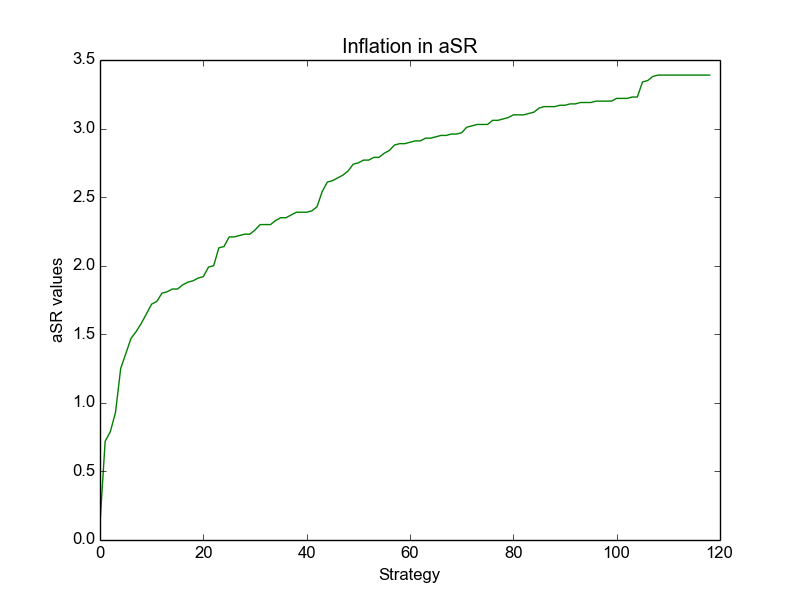
| Graphic on left illustrates the behavior of the trading strategy against the market behavior, by measuring the Sharpe Ratio (SR). The green line represents the trading strategy behavior. The blue line represents the market behavior. The purpose of this online interface is to show how the green line gets more and more profitable over time as the program continues to optimize the system to fit historical data. In a matter of seconds or minutes, the program creates what appears to be a very profitable equity curve (with a very high Sharpe Ratio (SR)) based on the input historical stock price dataset. | Graphic on right shows inflation in the Sharpe Ratio (SR). As you may see SR values are inflated; we are predicting future realizations of the series by using past realizations, which is of course impossible by construction (the series is IID - independent, identically distributed). |
Our (Backtest Overfitting Demonstration Tool or BODT) is an example of the first type. For the second type, we have developed the Tenure Maker Simulation Tool (TMST). We call it the tenure maker because many academic research results in finance are subject to the criticism that they have been produced in this way.
|
By checking this box, you acknowledge that this web site is a
demonstration of a mathematical concept known as the "tenure maker".
The software and material on this site should NOT be interpreted as a
recommendation to buy or sell any security or securities; as applicable
to the specific investment needs of any particular individual or
organization; or as applicable to the forecast of future market prices
or trends.
| ||
Option 1: Full (generates all strategies, no computational time limitation) | ||
| Please be patient! The program may take up to two minutes to display the results page after clicking Go! button | ||
Option 2: Limited (limited by the maximum allowed computational time) | ||
Default values: If you do not enter a value or enter a value that is outside the range mentioned above, a default value will be used. The default value for the maximum computational time is 90 seconds.
About execution time: The number of the strategies generated significantly affect the number of iterations performed by the program.
A more detailed explanation of options is provided in the tutorial.
We gratefully acknowledge the helpful comments and suggestions from colleagues and friends in shaping this web site. Their suggestions were extensive and very helpful in improving readability of the web pages. Thanks!