


The Butterfly Effect
Modeling the Weather
Edward Lorenz was a mathematician and meteorologist who had the idea to use computers to help him make a predictive model of the weather in the 1960s. He came up with 12 equations describing basic weather quantities such as air pressure, temperature, and wind.
Making Predictions
Although the equations were pretty simple, they were nonlinear differential equations, so they couldn’t be solved outright. The only way to know the eventual behavior of the system was to keep plugging in values. So, Lorenz set up his computer to take some initial conditions and use the equations to determine the changing quantities through time. He got printouts of all the data, and the model worked remarkably well. It seemed that Lorenz was on to something.
Taking Another Look
One day in 1961, Lorenz decided to reexamine some data that he had already considered. Instead of starting right from the beginning, to save some time, he picked up the simulation somewhere in the middle. Plugging in these conditions determined from the previous printouts, he reran just the later half of the simulation. While the new data was the same as the old at first, after a while, the new numbers started to wildly deviate from the original running. This was extremely puzzling, because these equations created a deterministic system- everything should be exactly the same.
Troubleshooting
After checking the computer to make sure it was functioning properly and pondering the possible differences between the first and second run, Lorenz realized that there was in fact one difference. He had used the numbers from the printouts which had 3 decimal places to save space, but the computer calculations carried 6 decimal places. But surely this seemingly insignificant difference wouldn't cause much difference in the final answer.
Small Problems Become Large
Unfortunately this wasn’t the case. The very small error had been amplified into huge differences in the long term outcome. It seems that there is actually no hope in making long term weather predictions. Small discrepancies in initial measurements lead to so much variety in the final outcome that we would have to have infinitely precise measurements to have any hope of making long term predictions.

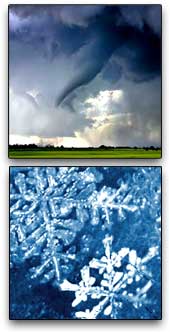
Tornados in Texas
So, Lorenz determined that weather is a chaotic system, because small changes in temperature, air pressure, wind, and humidity can cause drastically different weather later on. This is often referred to as the butterfly effect, an idea Lorenz came up with and presented at conferences in the mid 1960s. The idea is that a butterfly flapping its wings in Brazil could cause small changes in the atmosphere, and these unnoticeable changes could set off a chain of events that could lead to a tornado in Texas. The idea of chaos theory was born.
Delving Deeper
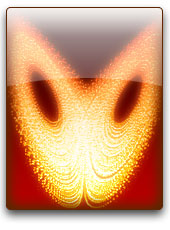
Further investigation was warranted. To simplify the problem, Lorenz reduced the 12 equations to 3, making something that was graphable in 3-space. The graph of this new system is called the Lorenz Butterfly and is a great way to demonstrate a system extremely sensitive to its initial conditions.
The path of the equations for any set of initial conditions never repeats itself and never crosses itself. Also, two sets of initial conditions that are really close to each other end up being extremely far away from each other later on. This is characteristic of a chaotic system.