Section 3.2 Level Curves
As we have seen, visualising the surface corresponding to the function \(z=f(x,y)\) can be quite difficult. One method that aids in this task is to draw level curves (sometimes known as contours). Level curves are the equivalent of contours on a topographical map. In such a map the terrain is shown by drawing curves through all points which have the same height above sea level. The numbers on the curves in the map shown below are the heights above sea level in metres. 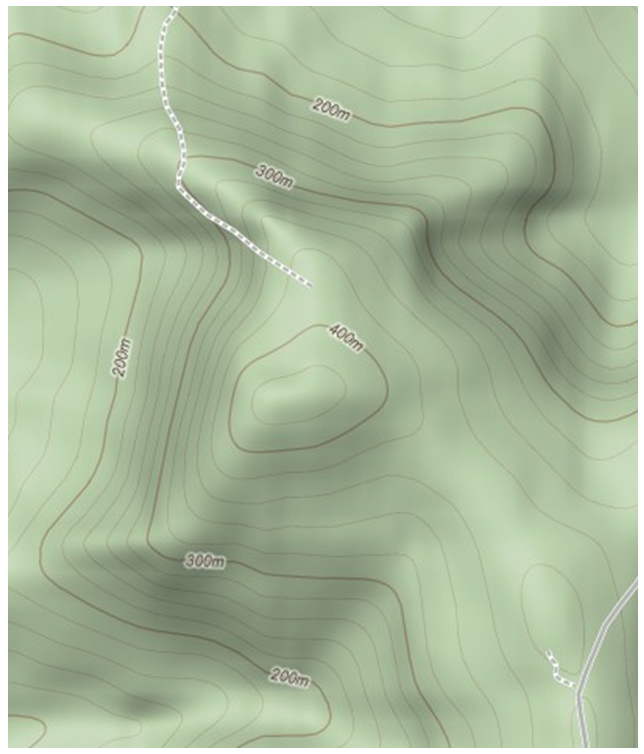
Definition 3.2.2.
The level curves of a function \(z=(x,y)\) are curves in the \(xy\)-plane on which the function has the same value, i.e. on which \(z=k\text{,}\) where \(k\) is some constant.Note:
Each point in the domain of the function lies on exactly one level curve.
When a collection of level curves for a function are drawn on the same plane it is sometimes called a contour plot.
We can also think of level curves as the intersection of the surface and the horizontal plane \(z=k\text{.}\)
Example 3.2.3.
Draw the level curves associated with \(k=-2,-1,0,1,2\) for the function
The level curves of a function satisfy the equation \(z=k\text{.}\) So for this function the level curves are:
Thus the level curves are rectangular hyperbolae (except for \(k=0\)). The level curves for \(k=-2,-1,0,1,2\) are shown in following diagram. 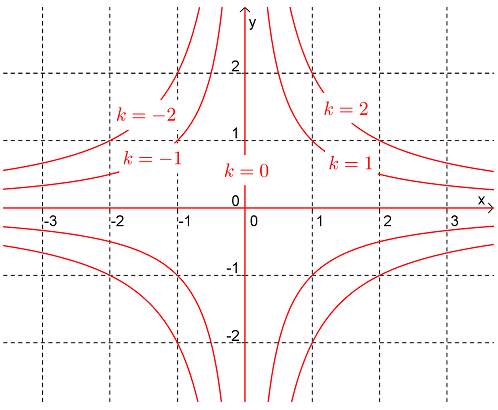
Example 3.2.5.
Draw a contour plot for the function \(z=x^2+y^2\text{.}\)
Solution.The contours (i.e. level curves) of a function satisfy the equation \(z=k\text{.}\) So for this function the level curves are:
that is, circles centred on the origin and whose radius is \(\sqrt{k}\text{.}\) 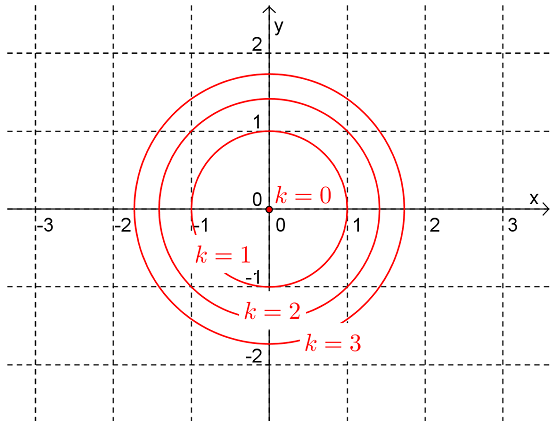
Exercises Example Tasks
1.
Draw the level curves associated with \(k=-2,-1,0,1,2\) for the function
2.
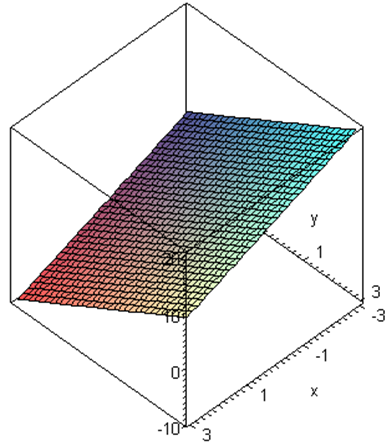
Make a rough sketch of the contour map (centred on the origin) for the function whose graph is:
3.
Make a rough sketch of the contour map (centred on the origin) for the function whose graph is: